Key figures
Economic
Results of operations, assets, and financial position
€ Million
Change in %
| 2022 | 2021 | 2020 | 2019 | 2022/21 | |
|---|---|---|---|---|---|
| Group revenue | 1,188.0 | 601.3 | 579.7 | 1,568.0 | 97.6 |
| EBITDA | 238.7 | –45.8 | –161.8 | 554.3 | |
| EBIT | –27.7 | –285.7 | –403.9 | 345.5 | |
| Consolidated earnings after taxes | –58.8 | –261.3 | –321.4 | 177.8 | |
| EBITDA margin in % | 20.1 | –7.6 | –27.9 | 35.4 | |
| EBITDA/Pax in € | 7.5 | –3.7 | –14.6 | 11.6 | |
| EBIT margin in % | –2.3 | –47.5 | –69.7 | 22.0 | |
| ROCE 1) in % | –0.6 | –6.0 | –8.4 | 7.6 | |
| Cash flow from operating activities | 159.4 | –45.8 | –116.0 | 429.1 | |
| Investments | 177.6 | 250.0 | 391.0 | 319.4 | –29.0 |
| Free cash flow | –15.4 | –273.5 | –503.8 | 109.1 | |
| Equity | 1,765.70 | 1,815.2 | 2,065.0 | 2,378.1 | 0.0 |
| Equity ratio in % | 32.2 | 33.0 | 37.4 | 42.9 | |
| Net Debt/EBITDA | 12.7 | –64.3 | –16.3 | 3.8 |
- ROCE = EBIT/(equity + net debt + ongoing employee benefits)
Ecological
CO₂ emissions
in tonnes
Change in %
| 2022 | 2021 | 2020 | 2019 | 2022/21 | |
|---|---|---|---|---|---|
| Direct emissions Scope 1 | 81,613 | 73,075 | 73,407 | 88,876 | 11.7 |
| Indirect emissions Scope 2 | 8,739 | 5,265 | 7,065 | 12,635 | 66.0 |
| Attributable CO₂ emissions | 90,352 | 78,340 | 80,472 | 101,511 | 15.3 |
Specific CO₂ emissions
In kilograms
Change in %
| 2022 | 2021 | 2020 | 2019 | 2022/21 | |
|---|---|---|---|---|---|
| CO₂ emissions per passenger | 2.85 | 6.27 | 7.24 | 2.12 | –54.5 |
Drinking water and wastewater
In cubic meters
Change in %
| 2022 | 2021 1) | 2020 | 2019 | 2022/21 | |
|---|---|---|---|---|---|
| Volume of purchased drinking water | 811.648 | 562.510 | 563.789 | 1.032.239 | 44,3 |
| Drinking water consumption per 1,000 TU 1) | 23,7 | 39,6 | 44,7 | 20,1 | –40,2 |
| Total wastewater discharged | 2.051.259 | 1.955.165 | 1.610.406 | 2.494.388 | 4,9 |
| Wastewater per 1,000 TU 1) | 59,8 | 137,6 | 127,7 | 48,5 | –56,5 |
- Traffic units
Social
Employee structure 1)
Number
Change in %
| 2022 | 2021 | 2020 | 2019 | 2022/21 | |
|---|---|---|---|---|---|
| Total | 8.610 | 8.693 | 9.338 | 9.806 | –1.0 |
| Women in % | 32.04 | 32.21 | 31.92 | 32.55 | –0.5 |
| Men in % | 67.96 | 67.79 | 68.08 | 67.45 | 0.3 |
| Full-time in % | 77.53 | 78.82 | 78.25 | 75.79 | –1.6 |
| Part-time in % | 22.47 | 21.18 | 21.75 | 24.21 | 6.1 |
| < 30 years in % | 11.58 | 10.96 | 13.09 | 15.68 | 5.7 |
| 30–50 years in % | 50.09 | 51.07 | 51.4 | 51.56 | –1.9 |
| > 50 years in % | 38.33 | 37.97 | 35.51 | 32.76 | 0.9 |
- Reporting date: December 31: Figures exclude apprentices, workers in minor employment, temporary workers, and interns
Apprentices
Number
Change in %
| 2022 | 2021 | 2020 | 2019 | 2022/21 | |
|---|---|---|---|---|---|
| Total | 230 | 247 | 287 | 303 | –6,9 |
Occupational health and safety
Number
Change in %
| 2022 | 2021 | 2020 | 2019 | 2022/21 | |
|---|---|---|---|---|---|
| Reportable occupational accidents | 225 | 107 | 94 | 236 | 110.3 |
| Resulting days of absence | 4,646 | 2,264 | 2,508 | 6,539 | 105.2 |
| Rate per 1,000 workers | 32.74 | 13.38 | 10.85 | 27 | 144.7 |
Operational
Air travelers
In millions
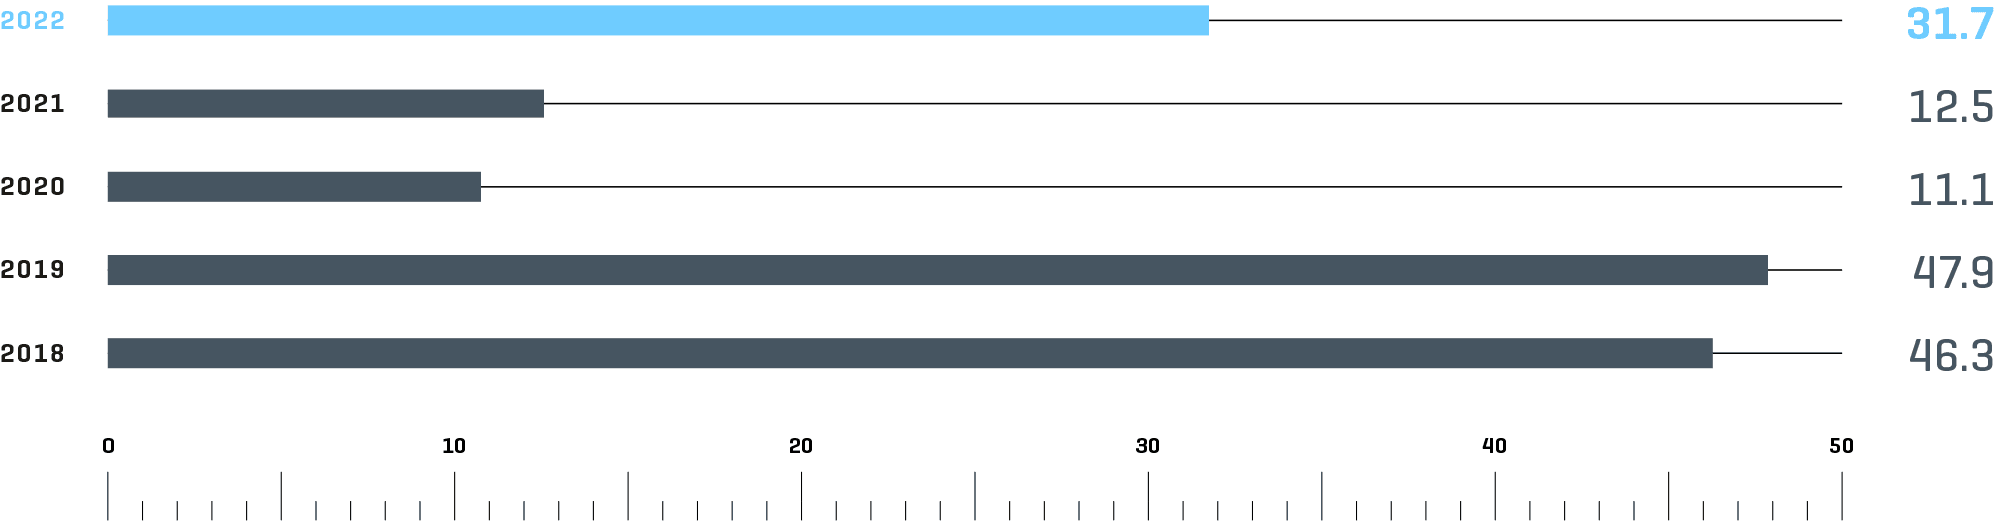
- With 31.7 million passengers in 2022, Munich Airport grew at a very dynamic rate compared to the previous year.
- Nevertheless, passenger numbers were approximately 66 percent of the 2019 reference year levels.
Aircraft movements
In thousands
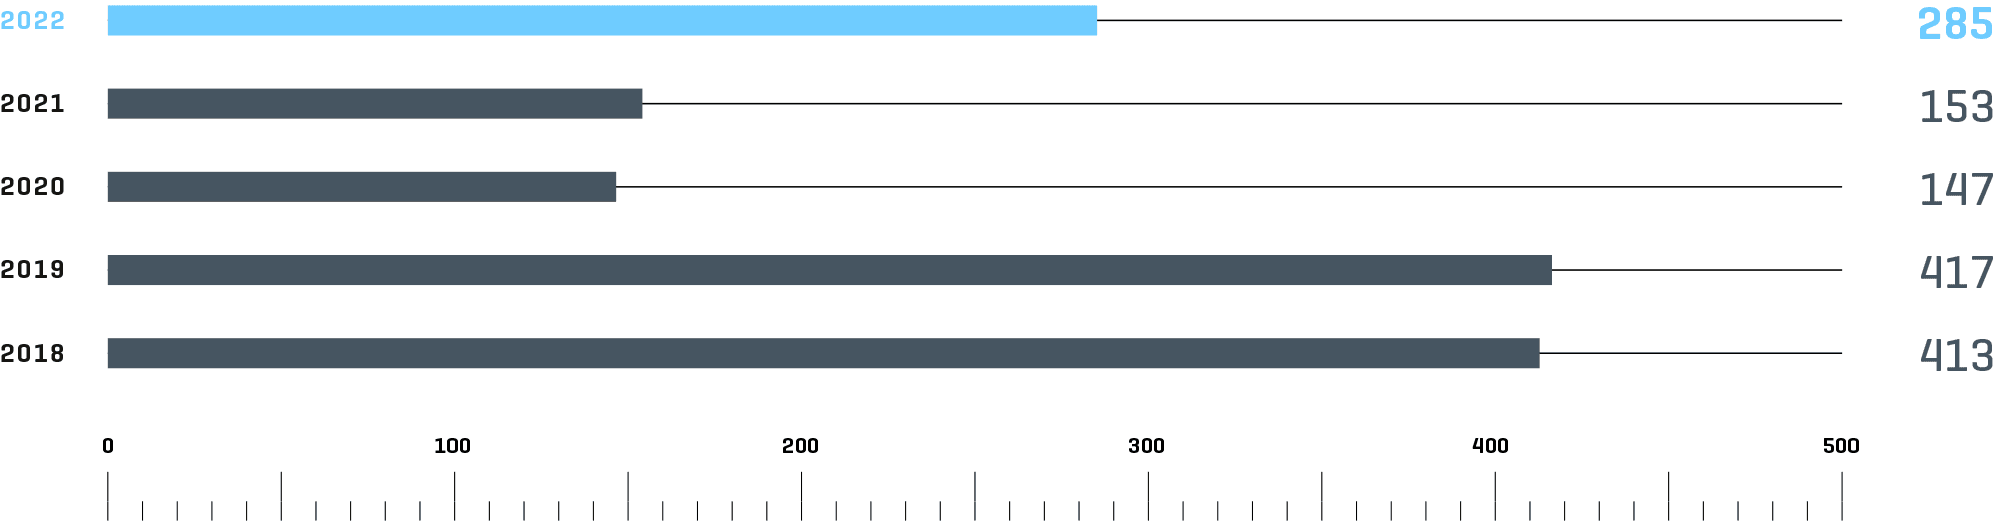
- Aircraft movements also rose sharply in 2022 compared with the previous year.
- However, they amounted to approximately 68 percent of the values for the 2019 reference year.
Management-related
Munich Airport has defined four key performance indicators to measure the development of the company. These key performance indicators are a measure of doing business in a sustainable and integrated manner and influence the variable remuneration components for managers.
Consolidated earnings before taxes (EBT)
€ million
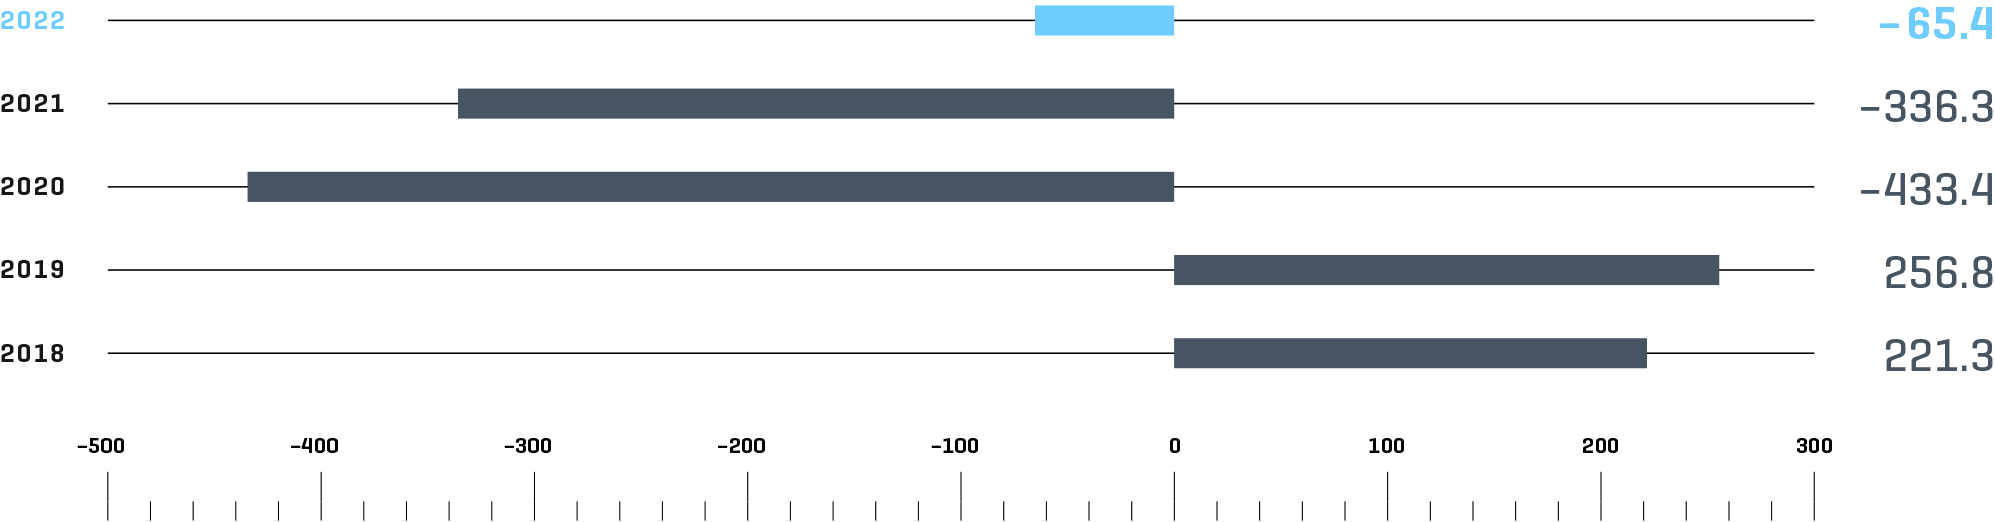
- In 2022, Munich Airport’s EBT was still impacted by the effects of the Corona pandemic.
- However, strict cost management yielded a better EBT than planned.
CO₂ reductions 1)
In Tonnes
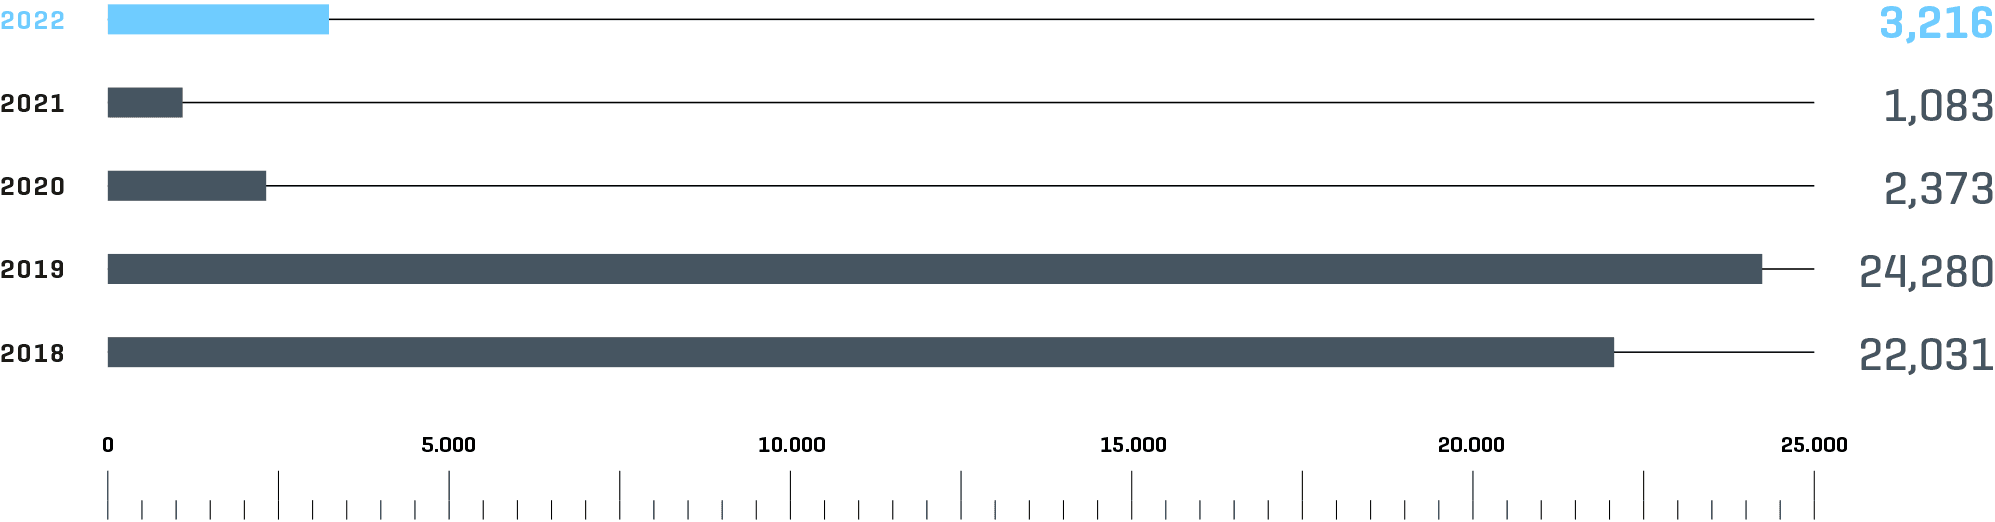
- Depending on the data basis, the savings are determined on the basis of measurements, product data sheets or performance data on nameplates and documented in the CO₂ database. In exceptional cases, experience values of comparable measures that have already been completed and verified are used.
- The expected catch-up effects did materialize in 2022. The previous year’s figure was exceeded significantly.
- The big increase is due to the implementation of delayed measures from the year 2021 and the new measures undertaken in 2022.
Lost Time Incident Frequency rate (LTIF) 1)
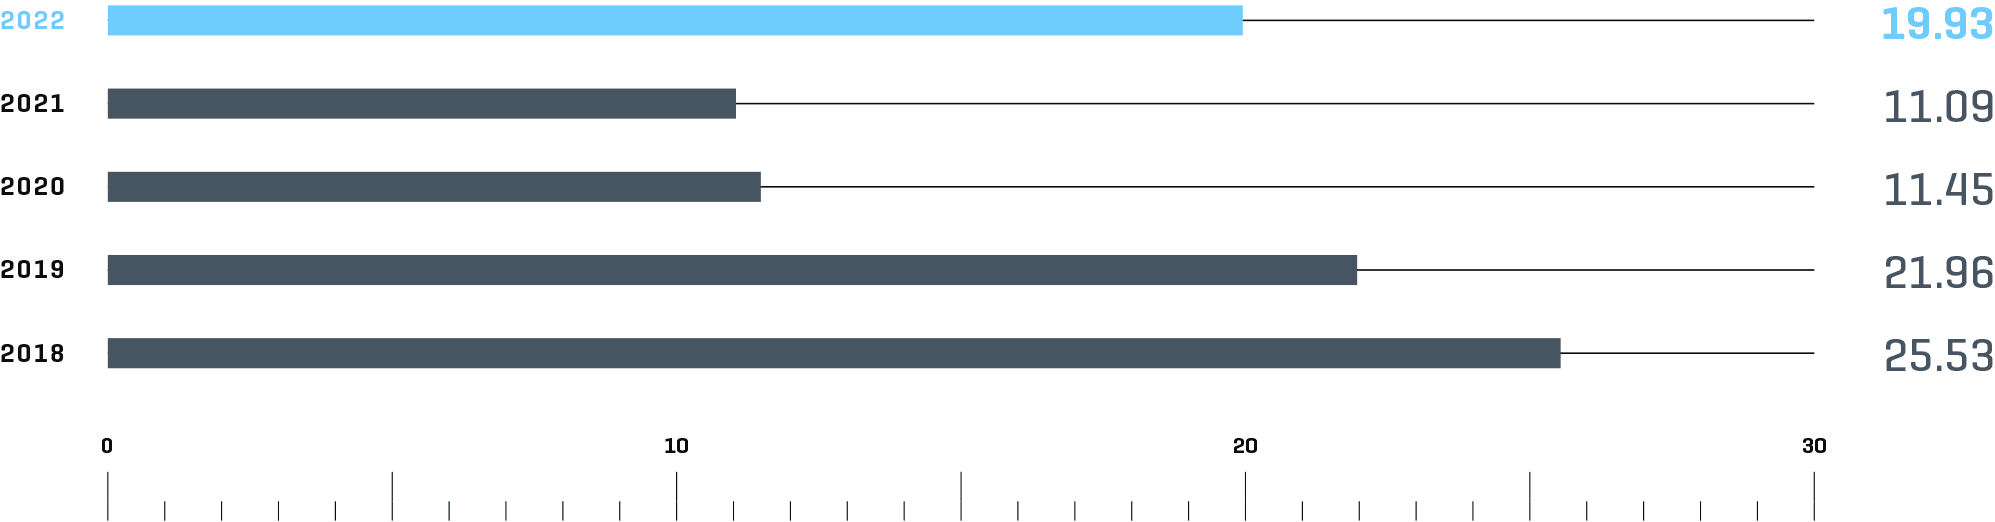
- Applicable to FMG and AE Munich; 2019 was used as the comparison period.
- Lost Time Incident Frequency (LTIF) represents an accident benchmarkable frequency rate.
- In 2022, the LTIF rate for FMG and AE Munich slightly exceeded the forecast value.
Passenger Experience Index (PEI)
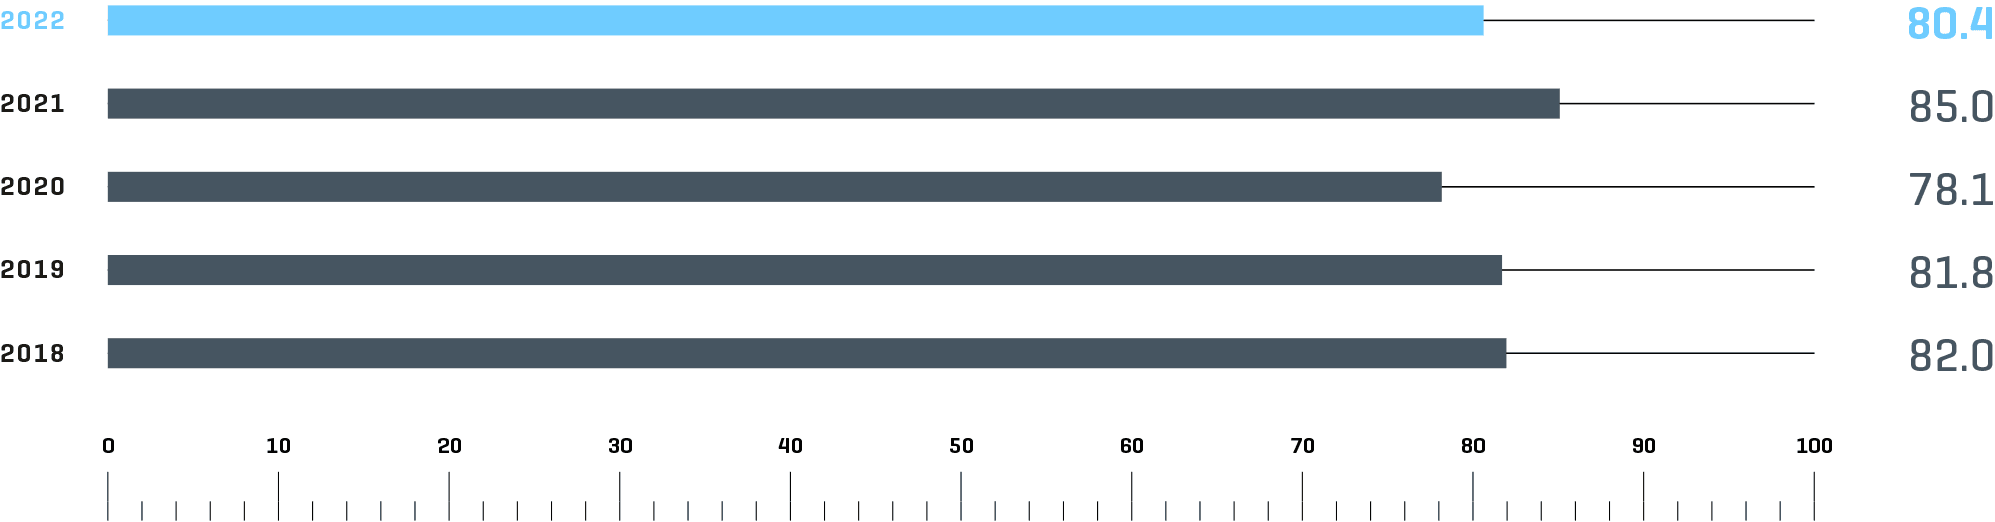
- Compared to 2021, Munich Airport saw a slight decrease in the satisfaction of passengers as measured by PEI in 2022.
- In 2022, Munich Airport once again implemented measures to improve passengers’ experience.